JANUARY 7, 2008 – Getting a picture of something as complex as the economy of the U.S. – the world’s – is not an easy matter. An earlier post showed that it is completely misleading to paint such a picture using only the “simple” figures of annual growth of Gross Domestic Product (GDP). To only use these “simple” GDP figures, you arrive at the ridiculous conclusion, pictured in the first graph of this article, that today’s U.S. economy is twice as big as in 1995, four times as big as in 1983, eight times as big as in 1976, 16 times as big as in 1969, 32 times as big as in 1958, and more than 60 times as big as in 1947 – a picture of triumphal, unending growth.[1]
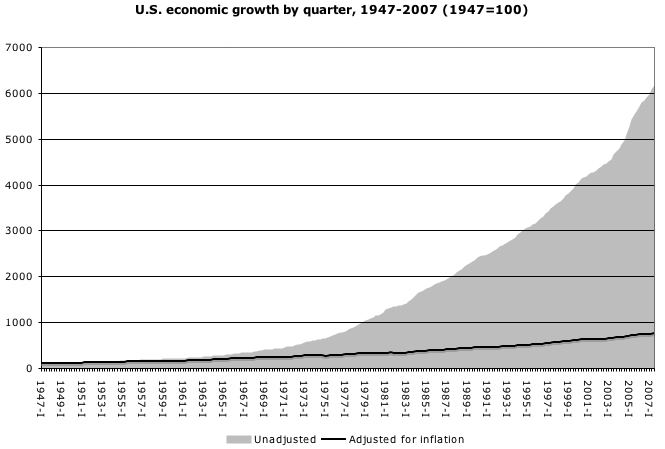
When statistics are presented in graphic form, as here, economic realities can be brought into focus in a way that is much more accessible than unending rows of statistics. For instance, the black line on this first graph shows what happens to “simple” growth figures when a very basic step is taken – adjusting those figures for inflation (price increases). To say the least, this changes the picture. There is still overall growth, but nothing on the scale implied when inflation is excluded.
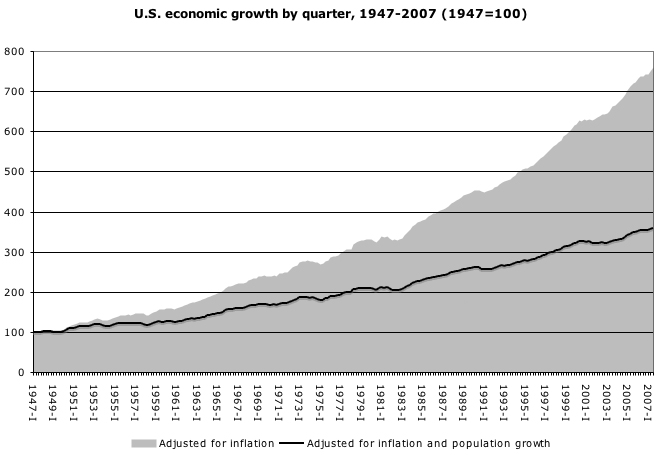
But this is still not a reasonable picture of the last 60 years of the U.S. economy. Growth statistics are also relatively meaningless if they don’t take into account population growth. A ten percent growth in population has to be matched by a ten percent growth in the economy just for everything to stay in the same place.
The second graph shows both figures – GDP in the U.S. reduced first by inflation (the grey area),[2] then reduced by both inflation and population increase (the black).[3] The result is a much more accurate picture of the growth of the U.S. economy over three generations.
But still the picture is not complete. What is meaningful to a working person is not only whether, in five years, the economy is going to be bigger than it is today. Equally and sometimes more important is the direction now. Is the economy we are living in today expanding or contracting, and how quickly?
There is a fairly accurate way of getting a picture of this. The reason the first graph has a Roman numeral “I” after the dates, is that is the traditional way of labeling each quarter of the year (I, II, III and IV). U.S. GDP figures are available quarter by quarter, and similar figures can be calculated for both inflation and population increases.
All of this can by combined to get “annualized” growth rates per quarter. This is a measure of how fast the economy is growing, or shrinking, in any given quarter. If the answer to that question is “five percent”, it doesn’t mean that the economy grew five percent in that quarter. It means that its rate of growth was five percent. This rate is determined by measuring back four quarters (one year), and seeing how much bigger or smaller the economy is, and from that calculating a rate. The resulting picture is fascinating.
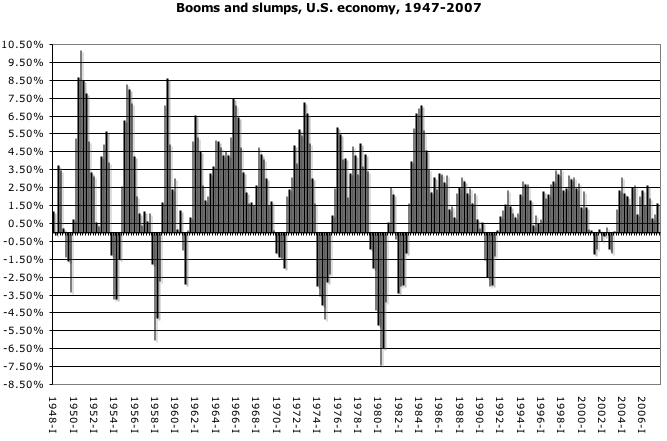
Serious analysts, both left and right, would not be surprised by this picture. Capitalism’s history is one of recurring periods of booms and slumps, or (in less extreme terms) of “business cycles” An advocate of capitalism like Joseph Schumpeter, argued almost 70 years ago that business cycles “are not like tonsils, separable things that might be treated by themselves, but are, like the beat of the heart, of the essence of the organism that displays them.”[4] The Russian socialist Leon Trotsky – writing more than 80 years ago, wrote that “capitalism lives “by crises and booms, just as a human being lives by inhaling and exhaling. First there is a boom in industry, then a stoppage, next a crisis, followed by a stoppage in the crisis, then an improvement, another boom, another stoppage and so on … Crises and booms were inherent in capitalism at its very birth; they will accompany it to its grave.”[5] Both Schumpeter and Trotsky could have been describing capitalism today.
The cycle of booms and slumps has to be a central feature of any accurate picture of the health of the economy. The graph here exactly confirms Schumpeter’s and Trotksy’s descriptions – this is a system inhaling and exhaling or to use Schumpeter’s analogy, a pulse – the very beating heart of the capitalist economy, booms followed by slumps.
Look at each decade. We know that the 1950s was a time of economic expansion. But that doesn’t mean there were no slumps, no recessions. Three sharp recessions punctuate the decade, short in duration, but sometimes very sharp. In the first quarter of 1958, for instance, the economy was contracting at a rate of almost six per cent. Workers at the time would get little comfort from being told that they were living through boom times.
The decade of the 1960s has the reputation of being the most spectacular decade of what has come to be known as the long boom – and there was considerable growth through the decade. But it opened with a two-quarter recession in 1960 and 1961, and was followed in 1970 by a full year of recession. Even in boom times, U.S. capitalism could not escape the boom-slump cycle. And by historic standards, the 1960s boom was not all that long. Trotsky argued that each business cycle “lasts from 8 to 9 or 10 to 11 years.” Well, the 1960’s cycle was about 10 years long. If anything, what this highlights is not the surprising length of the 1960’s business cycle, but the manic nature of the 1950s, where very high growth rates were punctuated by frequent returns to recession or slump.
Then we get to the 1970s. What a terrible decade. The 1970s recession was followed by three years of growth, and then the brutal slump of 1974-75, where the economy shrank consistently. In the fourth quarter of 1974, the U.S. economy was shrinking at a rate of 4.8 percent a year. There followed three and a half years of growth, and then an even worse slump, which in a real sense lasted from the second quarter of 1979 through the fourth quarter of 1982. (There was a brief return to growth in 1981, but so brief and so feeble that it felt like the recession was still ongoing.) At its worse, the U.S. economy was shrinking at a rate of 7.37 percent, in the second quarter of 1980, a really astonishing rate of decline.
The expansion of the 1980s was a welcome relief, only if you didn’t examine one of its principle sources – the massive re-arming of the U.S. – beginning under Democrat Jimmy Carter and continuing under Republican Ronald Reagan. That boom was shorter than its counterpart in the 1960s. Similarly, the recession which followed it in 1990-91 was shorter than the slump of 1979-82 (the steepest decline in the 1990-91 period was 2.97 percent, considerably less than the 7.37 percent rate ten years previous).
The story of the 1990s and the 21st century is still being written. It is true that there was a third long expansion of the system in the 1990s, but growth rates were lower than in either the 1980s or 1960s. There was a return to slump in the second quarter of 2001, and the period of decline or near decline lasted longer than in 1990-91, not ending until the second quarter of 2003. But the rates of economic decline in this slump were the lowest on record – never registering more than an annual decline of 1.17 percent. We seem to be on the edge of another slump, whose story will have to wait until another day.
Getting this into focus – the cycle of booms and slumps – is an important element in understanding the world in which we live. But even with this picture, there is considerable work to do. One very big missing piece is the overall trajectory. Trotsky introduces a third analogy to get at that picture. “[T]o determine capitalism’s age and its general condition – to establish whether it is still developing or whether it has matured or whether it is in decline – one must diagnose the character of the cycles. In much the same manner the state of the human organism can be diagnosed by whether the breathing is regular or spasmodic, deep or superficial, and so on.”
In more economic language he summarizes: [T]he curve of economic development is a composite of two movements: a primary movement which expresses the general upward rise of capitalism, and a secondary movement which consists of the constant periodic oscillations corresponding to the various industrial cycles.”[6] This article has only looked at the latter – the secondary movement. But even if not the full story, it is a necessary component in developing a complete picture of the current dynamics of the U.S. economy.
© 2008 Paul Kellogg. This work is licensed under a CC BY 4.0 license.
References
[1] Bureau of Economic Analysis, “National Income and Product Accounts Table: Table 1.1.5. Gross Domestic Product (Billions of Dollars), www.bea.gov.
[2] Bureau of Labor Statistics, “Consumer Price Index – All Urban Consumers,” Series ID: CUUR0000SA0, www.bls.gov <January 24, 2008>.
[3] Population Division, U.S. Census Bureau, “Table 1: Annual Estimates of the Population of the United States”; Population Estimates Program, Population Division, U.S. Census Bureau, “Historical National Population Estimates: July 1, 1900 to July 1, 1999,” www.census.gov <http://www.census.gov/popest/archives/1990s/popclockest.txt>
[4] Joseph Schumpeter, Business Cycles: A Theoretical, Historical, and Statistical Analysis of the Capitalist Process, volume 1 (New York: McGraw-Hill, 1939), p. v. Schumpeter is best known for his praise of the “Creative Destruction” inherent in periodic recessions (Schumpeter, Capitalism, Socialism and Democracy (New York: Harper, 1942), p. 82).
[5] Leon Trotsky, “Report on the World Economic Crisis and the New Tasks of The Communist International,” in The First 5 Years of the Communist International: Volume I (New York: Monad Press, 1972), p. 200.
[6] Trotsky, pp. 200-1.