OCTOBER 15, 2012 – In the run-up to the November 2 presidential election in the United States, polls are indicating an almost evenly divided electorate. As of this writing, support for President Barack Obama was standing just above 46%, support for Republican challenger Mitt Romney just above 47% (RealClearPolitics). Given these figures, imagine entering a room of 200 randomly chosen U.S. voters, with people sitting at tables by party-affiliation, but with no table signs to indicate which party-table was which. To avoid a night of tea-party polemics, you might reasonably wish to find a table of Obama supporters, and you figure the odds aren’t too bad – roughly 50-50. This is statistically true, but sociologically misleading. There is a straightforward way to qualitatively improve your chances of finding a table of Obama supporters, and avoiding a table of Romney supporters. The U.S. remains an extremely racially-divided society, and your encounter with an Obama supporter would be made much easier, with just a little research.
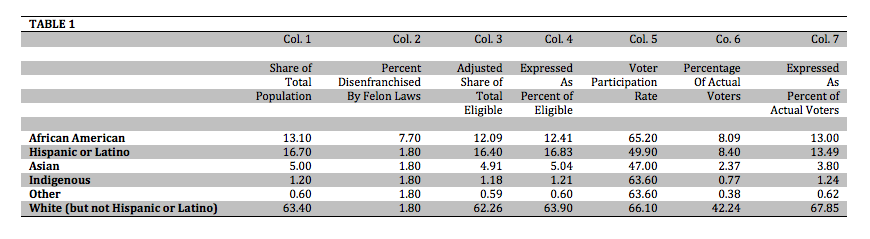
Follow, for a moment, the logic represented by Table 1, starting with Column 1, Share of Total Population.

According to the latest figures in the U.S. census, the country’s population breaks down as follows: approximately 1.2% are indigenous, 13.1% identify as African-American, 16.7% as of Hispanic or Latino origin, 5% as Asian, and 63.4% as white (Caucasian, excluding those who identify as of Hispanic or Latino origin) (United States Census Bureau 2012).
But this is not representative of the actual “voting universe” of the U.S. population. Fully 5.8 million U.S. citizens of voting age are excluded from voting – disenfranchised – because of laws in certain states which prohibit those with a criminal record from casting a ballot. Because of the widely-acknowledged, deeply racialized nature of the criminal justice system in the U.S., these laws disproportionately impact African Americans. For non-African Americans, these “felon laws” have the effect of excluding 1.8% of voting age adults. For African American citizens, the excluded percentage jumps to an astonishingly high 7.7% (Uggen, Shannon, and Manza 2012, 1).
To fully understand the intent and origin of these laws, examine for a minute where their effect is the most pronounced. “In six states – Alabama, Florida, Kentucky, Mississippi, Tennessee, and Virginia – more than 7% of the adult population is disenfranchised.” In Virginia and Kentucky, the figure is 20% or one in five. In Florida the figure is 23%, almost one in four (Uggen, Shannon, and Manza 2012, 1–2). All six – Alabama, Florida, Kentucky, Mississippi, Tennessee, and Virginia – were, of course, part of the old, racist Confederacy where plantation slavery was deeply entrenched until the Civil War. In the post Civil War era, the old white racist power structure found many methods to continue the disenfranchisement of African American citizens. Laughlin McDonald, Voting Rights Program Director for the American Civil Liberties Union (ACLU), is quoted in The Huffington Post, saying: “There’s no question this has a basis in race discrimination. It’s part of the history of the racial minorities in the South. The Southern states adopted a whole variety of measures to take away the right to vote after Reconstruction” (McLaughlin 2012).
Column 2 displays this 7.7% figure for African-Americans, while “1.8%” has been entered for all others, as the only two categories for which we have readily available statistics are “African-American” and “non-African American”. But given the enormous weight of African-Americans in the U.S. prison system, this will not appreciably distort the statistics. Column 3 shows the way in which this reduces the percent of the African-American population available to exercise their franchise, Column 4 expresses this as a percent (of all adults who are not excluded from voting by the ‘felon laws’).
Another adjustment has to be made (Column 5). There are quite different patterns of voter participation depending on ‘race’ or ethnicity. A reasonable benchmark would be the last (2008) presidential election. In that election, just 47.0% of Asian Americans voted, 49.9 percent of Hispanic-Latinos, 65.2% of African-Americans, and 66.1% of non-Hispanic Whites. We do not have accurate figures for Indigenous voters and “others”, so for those two categories, the overall turnout rate of 63.6% has been entered (Mark Hugo 2009). Column 6 shows the resulting percentage of actual voters by ‘race’ and ethnicity, while Column 7 expresses this as a percent of all adults who are likely to vote.
Using these statistics, Table 2 attempts to compare and contrast the voting tendencies of these groups, beginning with the raw data for each candidate listed in Columns 1 and 2.
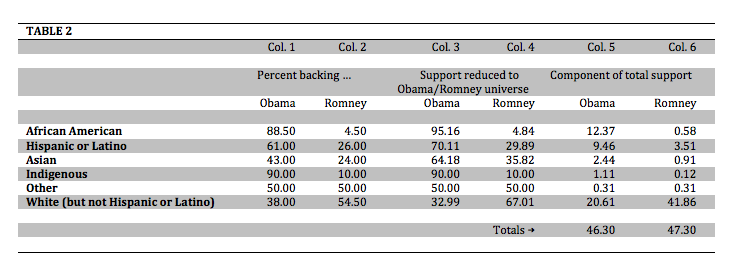
For Indigenous people, we do not have reliable information. In poll after poll after poll, when it comes to national politics, “Indian country is invisible,” in the words of Mark Trahant (2012). But given the fact that nearly 90% of indigenous voters in 2008 supported Obama (and given the tea-party base behind the Romney campaign), it is not unreasonable to expect an overwhelming majority to also support Obama in this election (Native Vote Washington 2008). Among African-Americans, support for Obama is also overwhelming. One recent poll had 94% of African-Americans supporting Obama and none supporting Romney (Murray 2012). More reasonable, probably, are figures from Gallup showing support for Obama at 88.5% and Romney at 4.5%. According to the same Gallup poll, among the Hispanic-Latino population, support for Obama runs at 61% compared to 26% for Romney. But for non-Hispanic whites, only 38% support Obama, compared to 54.5% who support Romney (Newport 2012). For the 0.6% who fit into none of these categories, we can, for the purpose of argument, arbitrarily split their vote 50-50 between Obama and Romney. This will not significantly change the results.
Two more steps are necessary to complete the voting profile for each candidate. The percentage figures, above, do not add up to 100, because they include those who support neither candidate, those who do not intend to vote, and those who have no opinion. The task here, however, is to restrict this to a universe of only Obama and Romney supporters. This is reflected in Columns 3 and 4, figures for each candidate adjusted so that their total adds up to 100 for each category. That done, we get our close to final results in Columns 5 and 6. There you can see the results for each candidate, by category, adding up to 46.3% for Obama and 47.3% for Romney.
Table 3 translates this into percentage terms (the percentage of supporters for both Obama and Romney who come from each of given categories of U.S. citizen).
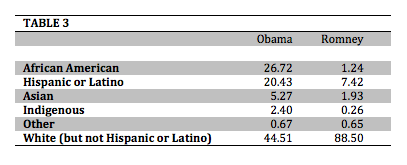
Look first at the column for Romney. An astonishing 88.5% of his supporters are white. The television images from the Republican convention were not misleading, when they portrayed an audience so white, that wearing sunglasses while you watched them on television was not a bad idea. No other category makes it to double-digit support. Just 1.24% of his supporters are African-American, 7.42 percent Hispanic or Latino, 1.93 Asian, and 0.26 Indigenous.
Contrast this with the support base for Barack Obama. More than one-quarter of his voting base (26.72%) is African-American, more than one-fifth (20.43%) Hispanic or Latino, 4.27% Asian and 2.40% Indigenous. White supporters for Obama make up less than half (44.51%) of his voting base, almost exactly half the percentage figure for Romney.
Finally, we can go to our room of 200 randomly chosen U.S. voters, and orient ourselves much more easily. A seating plan which divided the room between tables of Democrats and tables of Republicans would clearly reveal the colour line which continues to mar U.S. society. Of the 200, 102 would be Romney supporters, 98 Obama supporters. Of the 102 Romney supporters, fully 90 would be non-Hispanic whites, there would be no Indigenous people, 2 Asians, 8 Hispanic, and 1 African-American.
The 44 white supporters of Obama, would be outnumbered by the combined presence of 26 African-Americans, 20 who identify as Hispanic or Latino, five with an Asian background, and two Indigenous people.
There is another factor that needs to be taken into consideration – gender. More women support Obama (50%) than Romney (42%), but this is only because Obama has the overwhelming support of African-American women (89%) and Hispanic-Latina women (66%). When the universe is restricted to white women, Obama has the support of only 42% compared to 51% for Romney. Given the Republican positions on gender issues, this is a rather shocking statistic.
Let’s save the worst for last. In the universe of white men, Romney leads overwhelmingly with 58%, Obama far behind at 34%. Think about this. Just one white man in three supports Barack Obama. When the universe is restricted to those who are going to vote either Democrat or Republican, virtually two-thirds of the white men in that universe will be voting for Romney.
So go back to the room of 200 randomly chosen U.S. voters. If you are looking for a conversation about improving accessibility to health care, then scan the room, and avoid the table which is all white. Odds are that two-thirds of those at the table will be Romney supporters, and avidly opposed to “Obamacare” (and same-sex marriage, tax increases for the rich, regulation and control of the sale of semi-automatic weapons, etc. etc.). If it’s a table of white men, you’re in even more trouble.
You will quickly pick out the multi-racial table. Grab a chair, and you can have a dinner conversation, as opposed to a tea-party polemic. Not that there won’t be some arguments. While you’re discussing healthcare and choice on abortion, it would probably be a good idea to raise, for instance, the question of the use of drones for extra-judicial and illegal bombing, assassination, and the killing of civilians in Global South countries. The dinner might get uncomfortable as a result, but it’s an important issue to raise nonetheless.
In 2008, Obama won because his base enthusiastically mobilized. In 2012, his re-election is in jeopardy, because big sections of that base have become disillusioned. Obama’s whole presidency has been about taking his base for granted, and trying to look “moderate” to increase his support in the largely white Republican world. It’s a dangerous strategy, because a) there is little evidence that the white Republican base is about to shift in numbers and b) without a big turn-out from his own base, he could lose.
This is particularly true because Romney has no such qualms. His disgusting remark writing off 47% of the U.S. electorate was based on the realization that he has little hope of breaking out of his white citadel. His whole strategy now is to do everything he can to mobilize that base, increase its turnout at the polls, and swamp the Democrats with a mobilized, angry, anti-Obama (white) vote.
In 1903, the great African-American scholar W.E.B. Du Bois picked up a term used earlier by Frederick Douglass. “The problem of the twentieth century,” he wrote in one of his masterpieces, The Souls of Black Folk, would be “the problem of the color line” (Bois 2005, chap. The Forethought). Our brief examination of the 2012 U.S. presidential election, shows that this colour line remains a problem in the second decade of the 21st century.
© 2012 Paul Kellogg. This work is licensed under a CC BY 4.0 license.
References
Bois, W. E. B. Du. 2005. The Souls of Black Folk. Kindle. New York: Bantam Classics.
Mark Hugo, Lopez. 2009. Dissecting the 2008 Electorate: Most Diverse in U.S. History. Washington, D.C.: Pew Research Centre. http://pewresearch.org/pubs/1209/racial-ethnic-voters-presidential-election.
McLaughlin, Michael. 2012. “Felon Voting Laws Disenfranchise 5.85 Million Americans With Criminal Records: The Sentencing Project.” Huffington Post. http://www.huffingtonpost.com/2012/07/12/felon-voting-laws-disenfranchise-sentencing-project_n_1665860.html.
Murray, Mark. 2012. “NBC/WSJ Poll: Heading into Conventions, Obama Has Four-point Lead.” First Read. http://firstread.nbcnews.com/_news/2012/08/21/13399788-nbcwsj-poll-heading-into-conventions-obama-has-four-point-lead.
Native Vote Washington. 2008. “Obama Draws Nearly 90% of Native Vote.” http://nativevotewa.wordpress.com/2008/10/31/obama-draws-nearly-90-of-native-vote/.
Newport, Frank. 2012. Obama Remains Women’s Presidential Pick; Romney, Men’s. Washington, D.C.: Gallup. http://www.gallup.com/poll/156848/obama-remains-women-presidential-pick-romney-men.aspx.
RealClearPolitics. “2012 – General Election: Romney Vs. Obama.” http://www.realclearpolitics.com/epolls/2012/president/us/general_election_romney_vs_obama-1171.html.
Trahant, Mark. 2012. “Elections 2012: Invisible in the Polls – Why Indians Don’t Count.” Indian Country Today Media Network.com. http://indiancountrytodaymedianetwork.com/2012/09/27/elections-2012-invisible-in-the-polls-%e2%80%93-why-indians-dont-count-136189.
Uggen, Chirstopher, Sarah Shannon, and Jeff Manza. 2012. State-Level Estimates of Felon Disenfranchisement in the United States, 2010. Washington, D.C.: The Sentencing Project. http://www.sentencingproject.org/detail/news.cfm?news_id=1334.
United States Census Bureau. 2012. “State & County QuickFacts.” http://quickfacts.census.gov/qfd/states/00000.html.
Absolutely right. I've made the correction. Thanks much for pointing this out.
Points well taken. Kentucky was not part of the confederacy however. It was a "neutral" state. Still much racism in that state (I am from there) but just thought you would want to make sure what you are saying is entirely factually accurate.